Outcomes Report
Outcomes Report shows how profitable a certain outcome would be across all season matches.

How it works
The system simulates a full-season run of bets on the selected outcome in all matches of the team. It calculates how often the outcome came through and whether it would have been profitable — revealing if this type of bet is systematically over- or underestimated.
Circle Indicator Explained

The circle shows the combined ROI of both teams for the selected outcome. If one team logo is shown, it reflects the ROI difference between teams. If two logos appear, the value represents their average ROI.
Available Markets
1X2 — Match result
Asian Handicap — Full time, 1st half, 2nd half
Total Over — Total goals scored
First Goal — Who scores the first goal
Both Teams to Score - Yes
Individual Total Over — Total goals scored by selected team
Opponent’s Total Over — Total goals scored by the opponent
Understanding Match-by-Match Outcomes
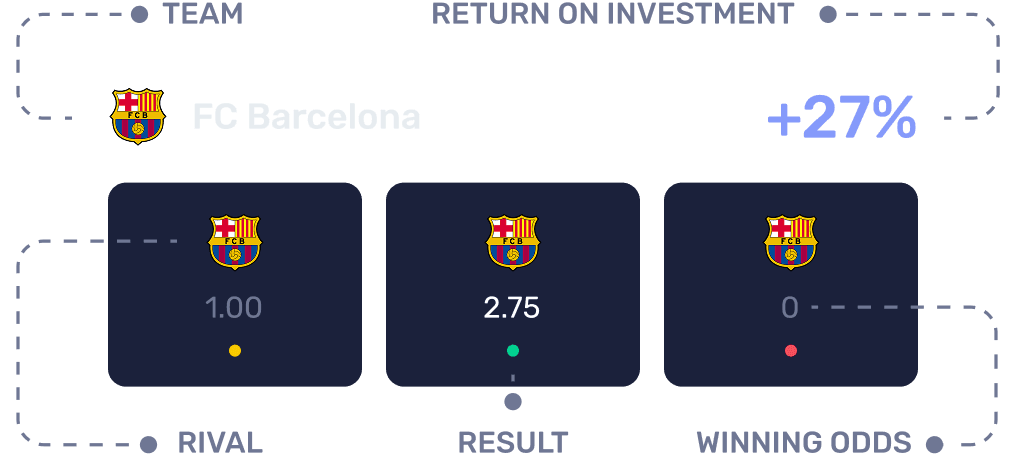
Cards display the rival team, result, and odds for each recent match, based on the chosen outcome. Green means a win, yellow — a refund, red — a loss. The percentage shows the overall ROI.
Practical Use
Outcomes Report helps identify which outcomes are systematically underrated, allowing you to build data-driven result expectations instead of guessing.