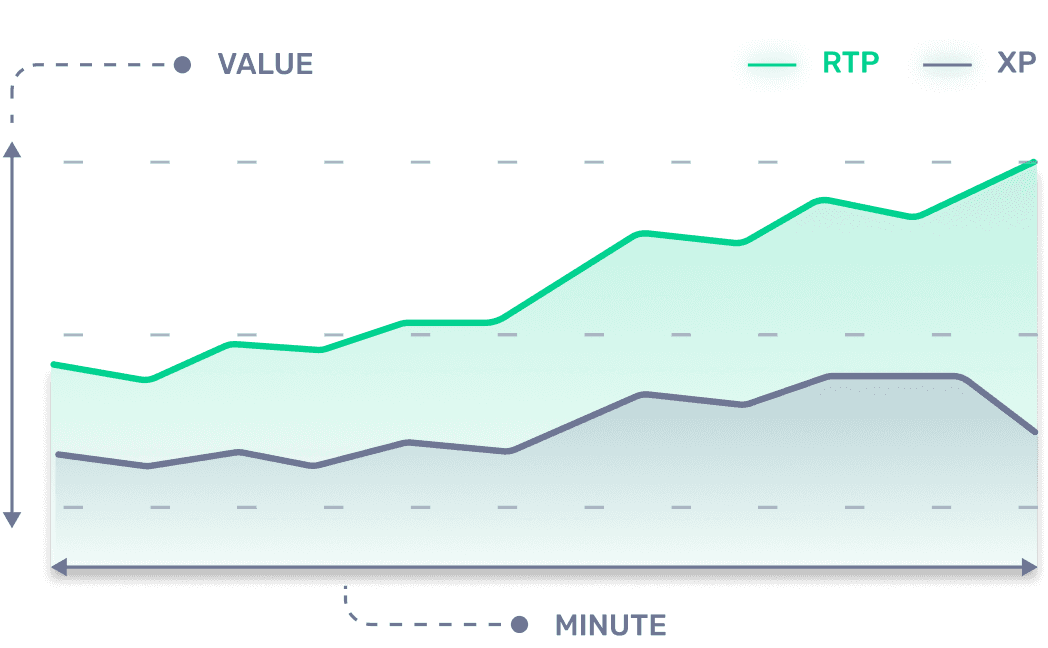
Performance graph
Performance Graph compares real-time performance with expected performance. It shows if the team is underperforming or exceeding expectations.
What are rtP and xP?
Real-Time Power (rtP) - combines all real-time stats to show how your team is performing against the opponent.
Expected Power (xP) - shows the expected level of team performance based on similar matches.
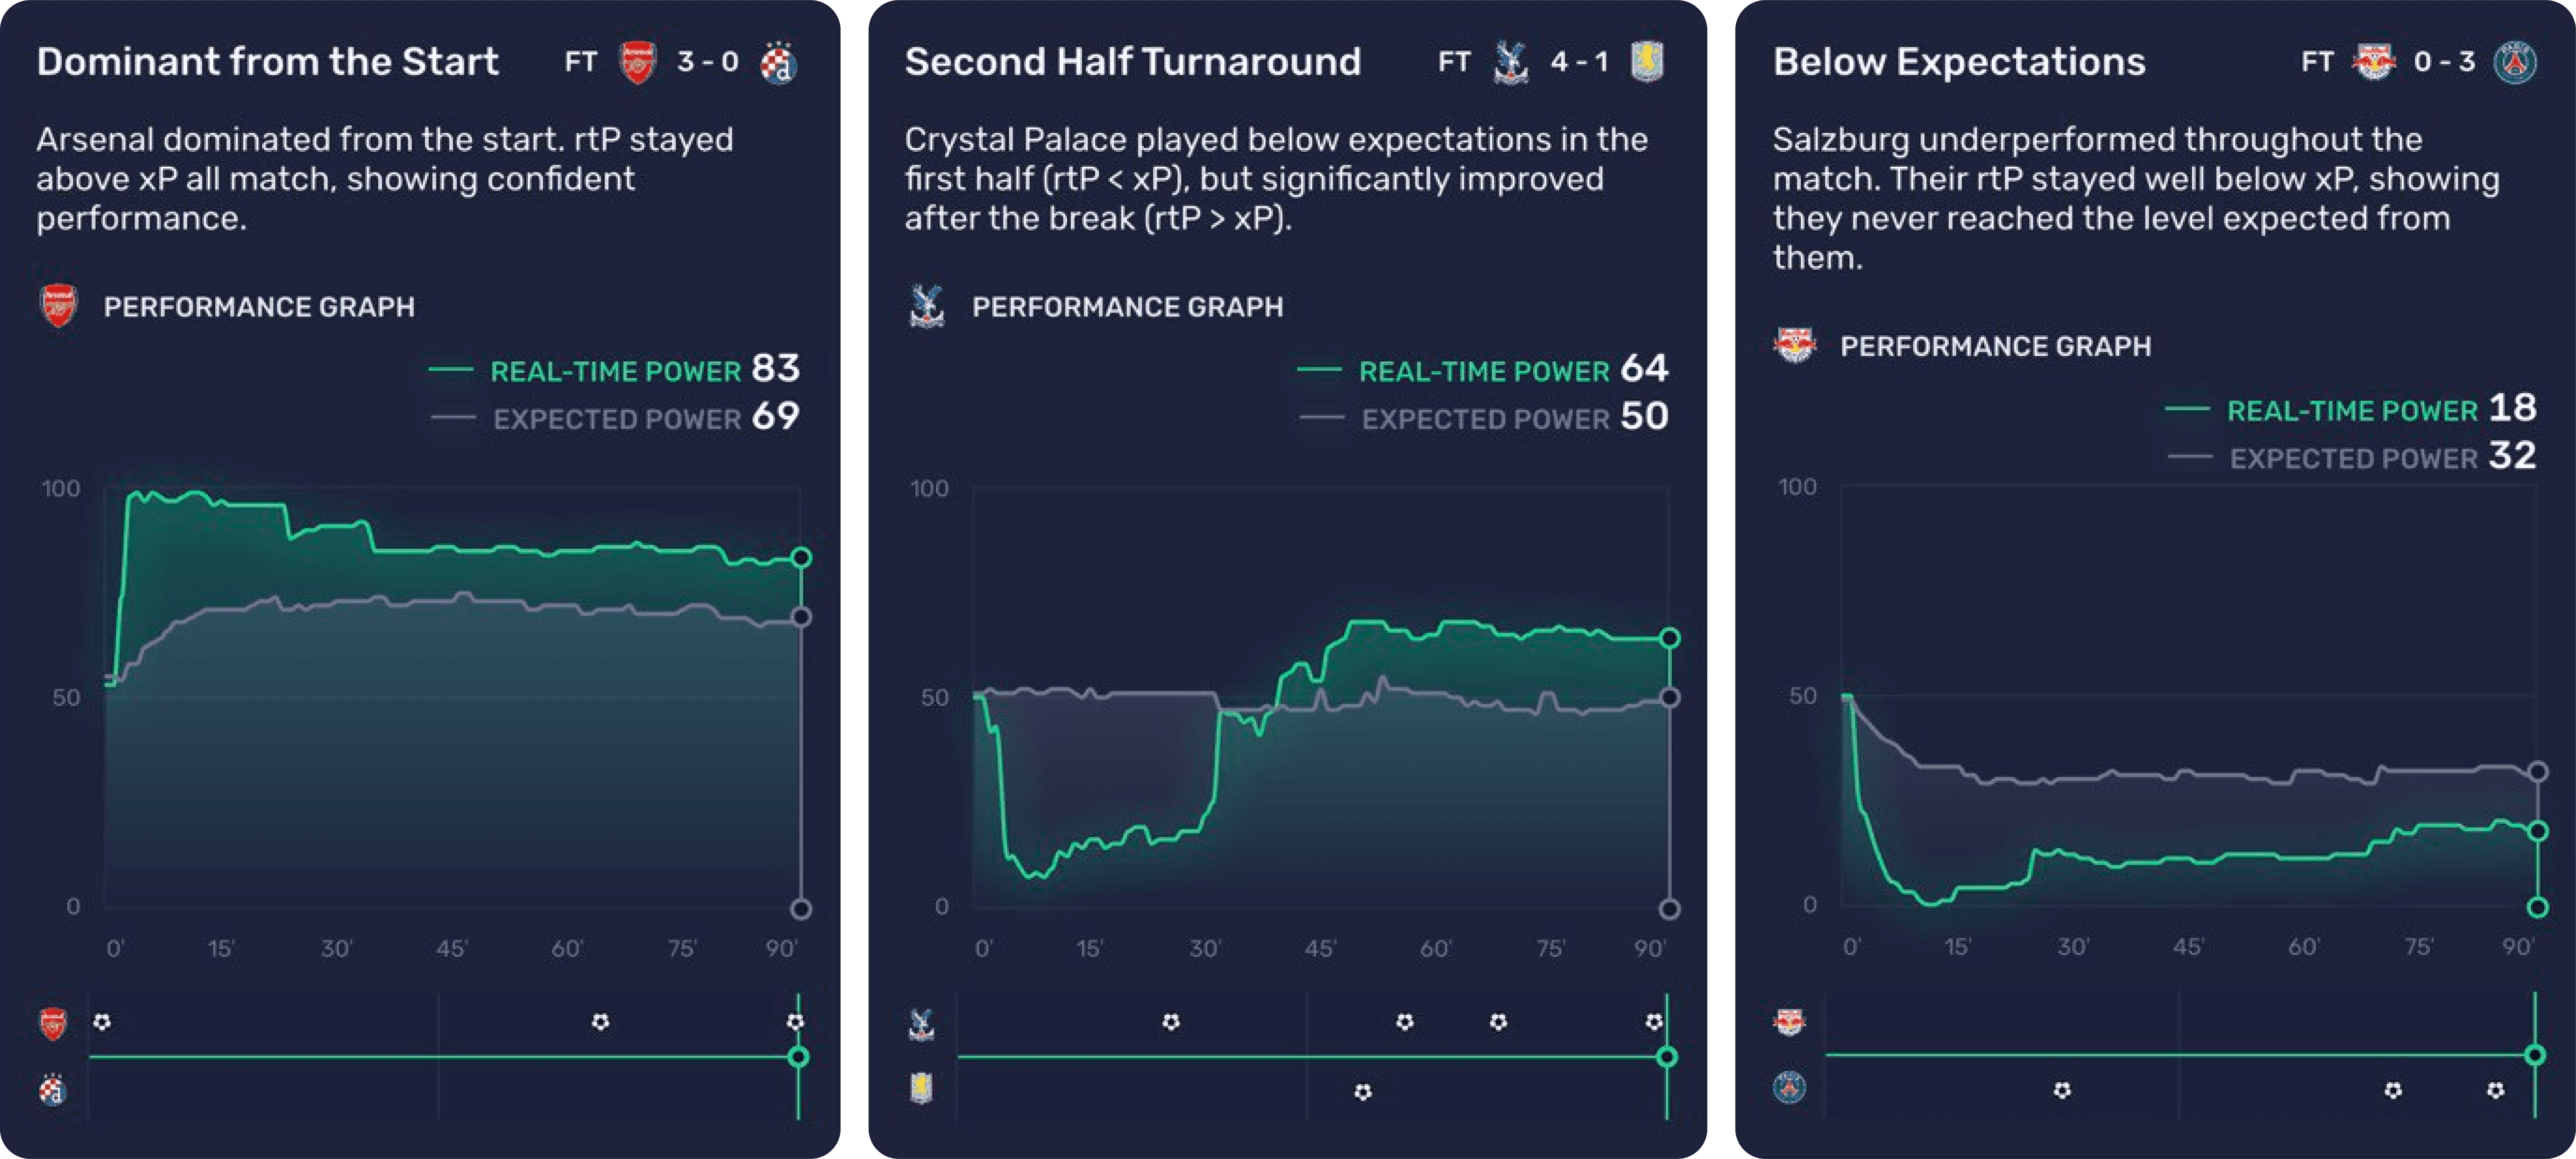
Let's see how this works in real matches
How is rtP calculated?
Real-Time Power (rtP) measures how strong a team is playing right now. It’s calculated minute-by-minute based on a set of in-game statistics from over 2,200 tournaments worldwide. The algorithm evaluates overall gameplay and outputs a value between 1 and 100.
How is xP calculated?
Expected Power (xP) shows how well a team was expected to play in this match. It’s based on the average rtP values from past games with similar pre-match odds. xP gives context to rtP — helping you see if a team is overperforming or underperforming.
Understanding the Scores
Real-Time Power (rtP) always adds up to 100 between both teams. If your team has 63, the opponent has 37 — meaning you're dominating the game. The higher your number, the stronger your performance compared to the opponent.
Only Available During Live Matches
This feature relies on real-time match data and becomes available only while the game is in progress.
How Often Is the Data Updated?
Real-Time Power (rtp) is recalculated every minute using the latest in-game data, ensuring a live and accurate reflection of team performance.