Real-Time Power (rtP)
Real-Time Power (rtP) combines all real-time stats, from possession to advanced metrics like EPV, to show how your team is performing against the opponent.
How is rtP calculated?
This metric is calculated as a weighted average of all real-time match statistics (such as possession, shots, EPV, xG, etc.) and is compared against the opponent's corresponding values. Similar to how ball possession is expressed as a percentage, this metric reflects a team's overall performance relative to the opponent in real time.
Practical Use
Real-Time Power (rtP) helps you spot momentum shifts, early signs of dominance, or sudden drops — even before the score changes. It’s the fastest way to see who’s in control.
Where It’s Used in the App
Real-Time Power is shown across key sections of the app:
Match Cards — circles next to team names show live rtP
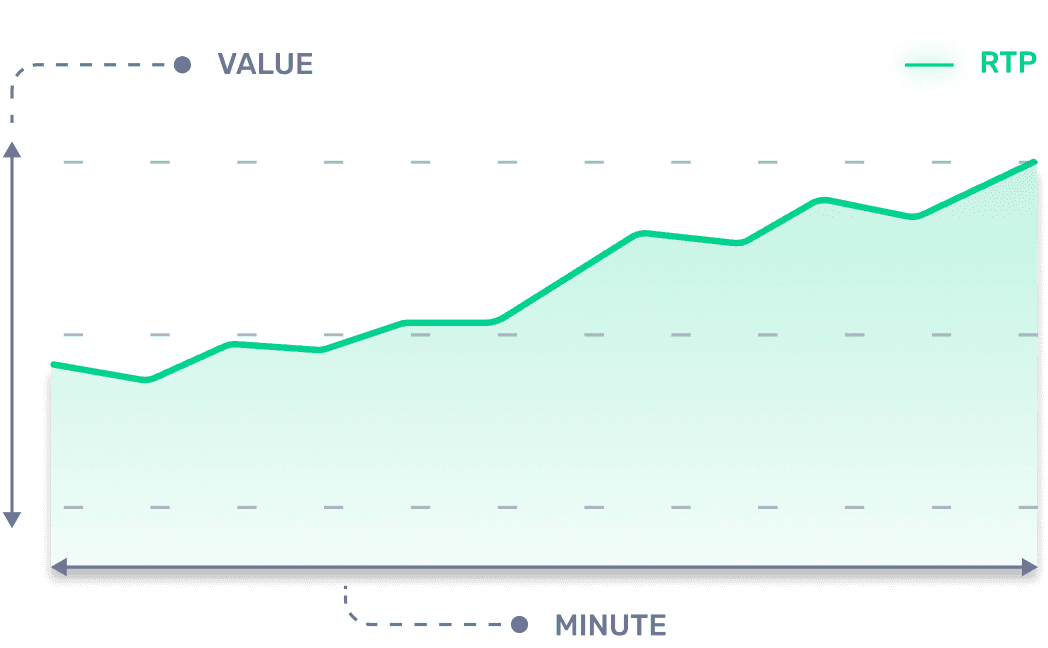
Performance Graph — visualizes how rtP evolves over time
rtPI & Similar Matches — uses rtP as core input to find patterns
Real-Time Advantage (rtA) — difference between rtP and xP
Season Stats — average rtP values across matches
Insights & Trends — helps to find the most outstanding performances
Understanding the Scores
Real-Time Power (rtP) always adds up to 100 between both teams. If your team has 63, the opponent has 37 — meaning you're dominating the game. The higher your number, the stronger your performance compared to the opponent.
Only Available During Live Matches
This feature relies on real-time match data and becomes available only while the game is in progress.
How Often Is the Data Updated?
Real-Time Power (rtp) is recalculated every minute using the latest in-game data, ensuring a live and accurate reflection of team performance.