Real-time Power (rtP) and Expected Power (xP) charts
We all know the feeling of looking at real-time or post-match stats and seeing controversial data. Numerous indicators fail to reveal anything about match dynamics, team advantages, or initiative changes.
Real-time Power (rtP) and Expected Power (xP) are metrics that possess two main qualities: they help fans understand which team demonstrates better gameplay and compare it with expectations.
rtP is calculated on the basis of basic stats data from every match in more than 2200 tournaments live! rtP evaluates any team’s gameplay level minute-by-minute and calculates a score from 1 to 100 that reflects the gameplay quality.
The gameplay level is relative and varies depending on the opponent. That's why we introduced xP, which shows the expected performance level of a team in a match. xP is the average rtP level which calculated on the basis of matches with the same odds. Like rtP, xP is available live for all teams worldwide.
Together, these metrics help fans identify which team is playing better and determine if the gameplay is typical for the team or if it is exceeding initial expectations.
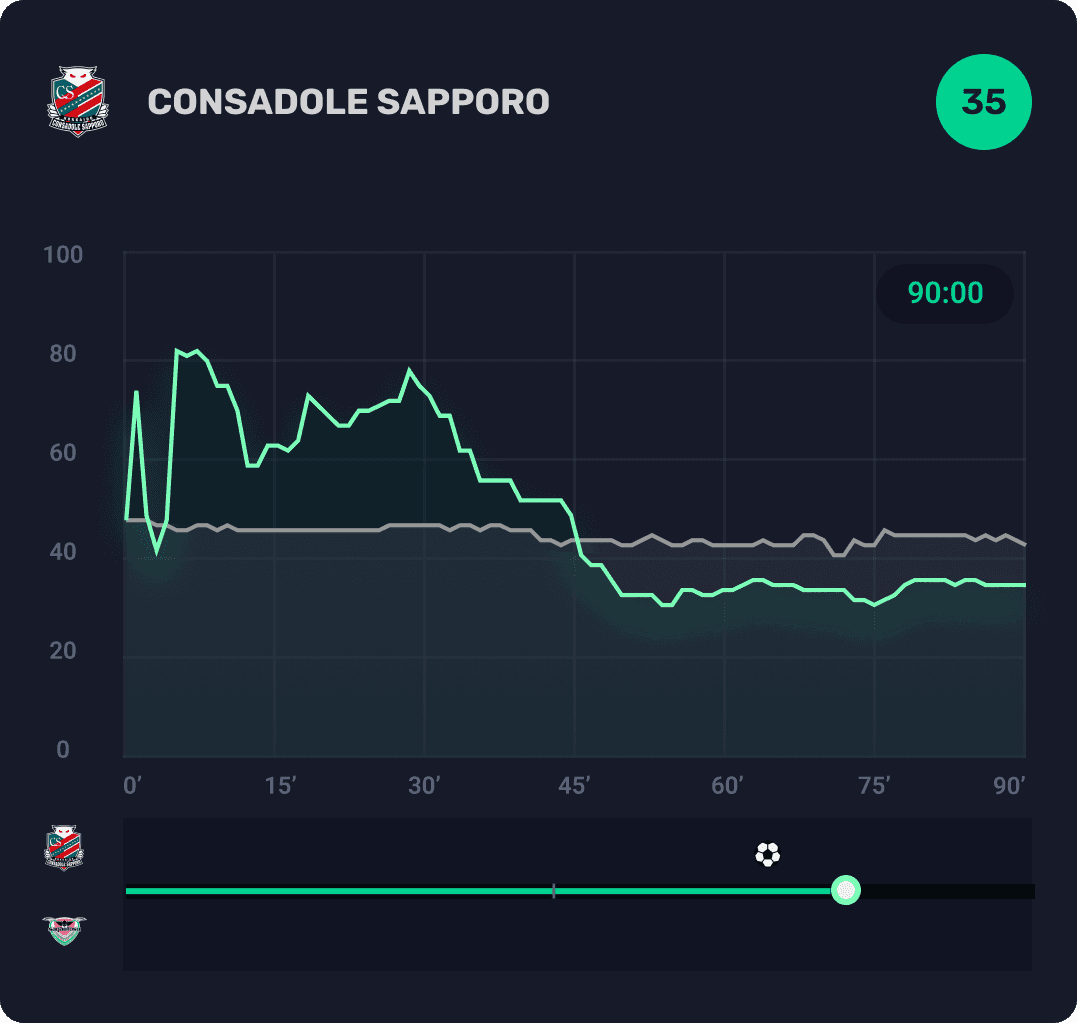
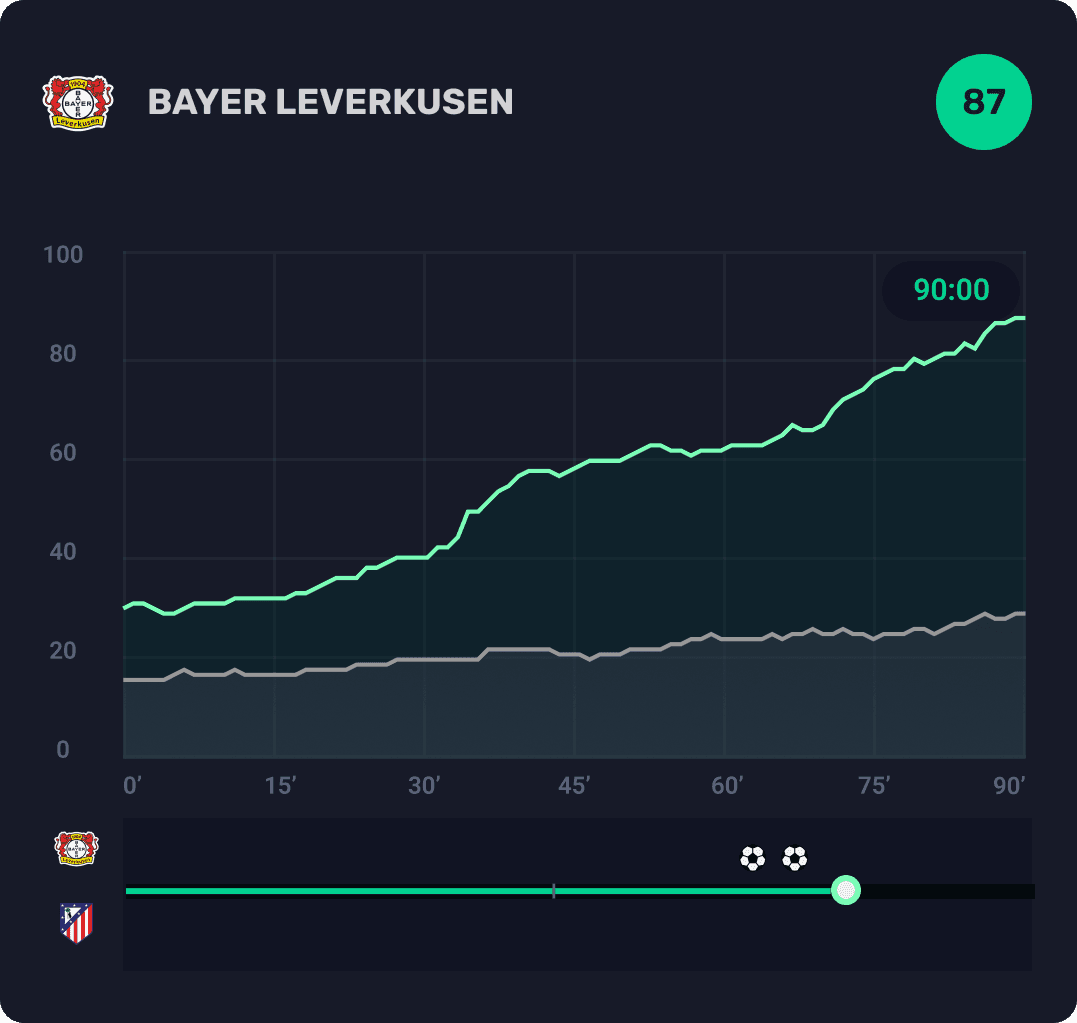
Explore the rtP and xP graph lines on the Performance Graph! This graph clearly and simply illustrates the dynamics of both metrics.

These lines illustrate how the match evolved, helping you understand:
The team’s gameplay quality and which team played better (if the team had rtP >50).
Whether the team performed better or worse than expected.
The maximum value for both metrics is 100. If one team has 64 rtP level that the opponent has a 36 rtP.
Everything is clear, but what insights can fans derive from it?
Compare rtP and xP graph values for a specific minute to understand the Real-time Advantage (rtA). If the rtP line is higher than the xP line, then the team is playing better than expected and vice versa.
Real-time Advantage (rtA), the difference between rtP and xP, shows how a team is performing against initial expectations. The higher the rtA, the better the team is playing.

Let's analyse real matches.
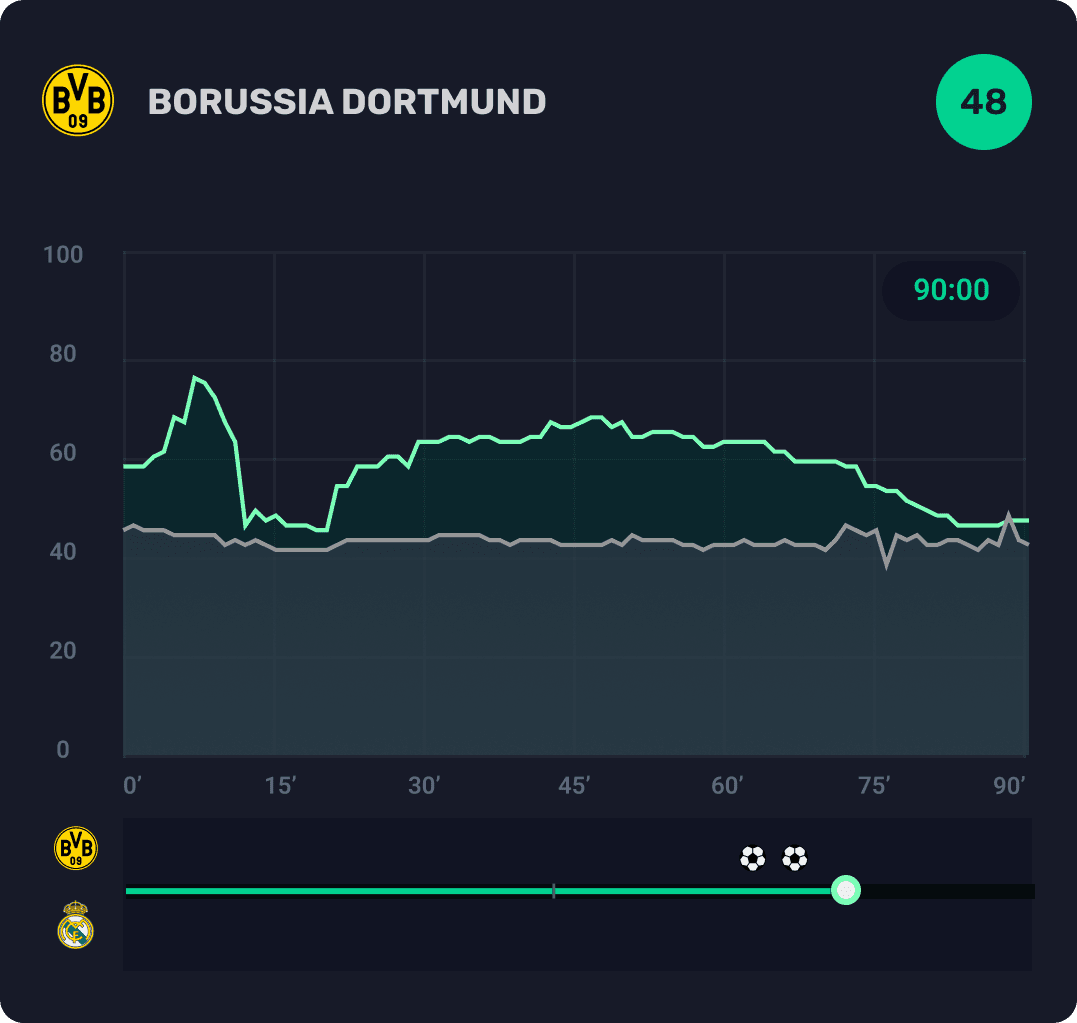
Here is the Borussia Dortmund vs. Real Madrid match from the UCL 2024 finals. Borussia dominated early and performed better than expected. However, in the second half, they lost their initiative, and their rtP rank dropped. Real Madrid scored twice, confirming the rtP downfall trend.

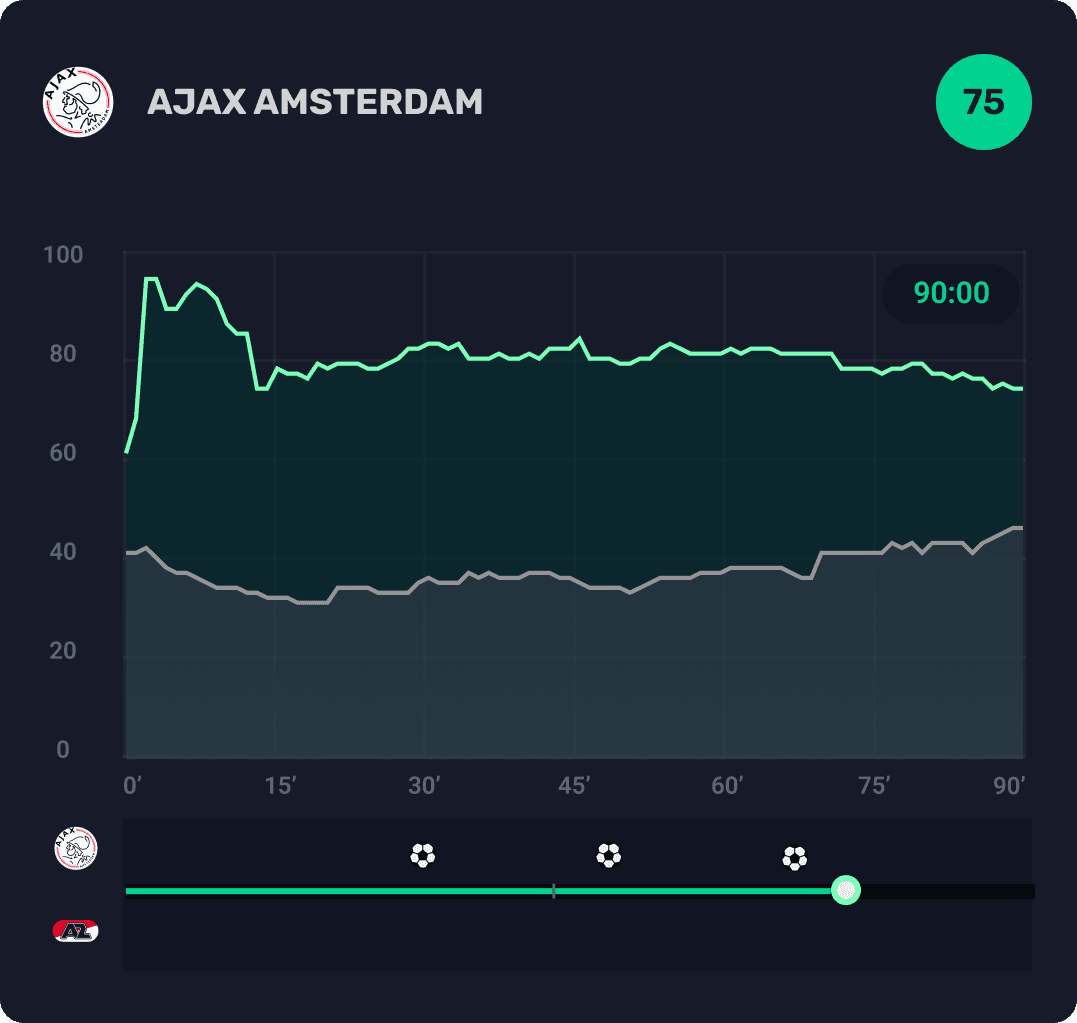
Or consider the match between Ajax Amsterdam (w) and AZ Alkmaar (w). Ajax Amsterdam (w) was considered an underdog according to the xP chart. However, it played much better than expected, resulting in a high rtA.

While the rtP and xP graph lines depict how the match is evolving to this minute, can they predict the future? Yes! The Expected Trends feature offers fans a unique way to observe future statistical trends.
Read more about how to derive insights from Expected Trends feature.