Similar Match Technology: Innovative Approach to Analysis
Whenever we watch a game, we compare teams' performances with other potential rivals. This helps us create personal power rankings and draw conclusions about future matchups.
To compare different teams, we need a common metric that measures the quality of any game. Metrics like xG, xT, key passes, field tilt, and PPDA are designed for coaches to improve the game but not to explain it to regular fans and more importantly, do not have a predictive power. It's common to see one team with a higher xG and their opponents with a higher xT. In the next match we may see the opposite picture.
AIstats aims to change this paradigm. We use rtP and xP metrics for this purpose to unlock smart insights about the game.
Read more about how to use rtP and xP on the Performance Graph
We have analysed over 12 million scenarios, enabling us to identify trend patterns that can predict how the game may evolve based on rtP, xP, rtA and xPG values. We called this algorithm the Similar Match Technology. It projects the rtP and xP line graphs based on historical performances of 0.3% of teams with similar gameplay patterns.
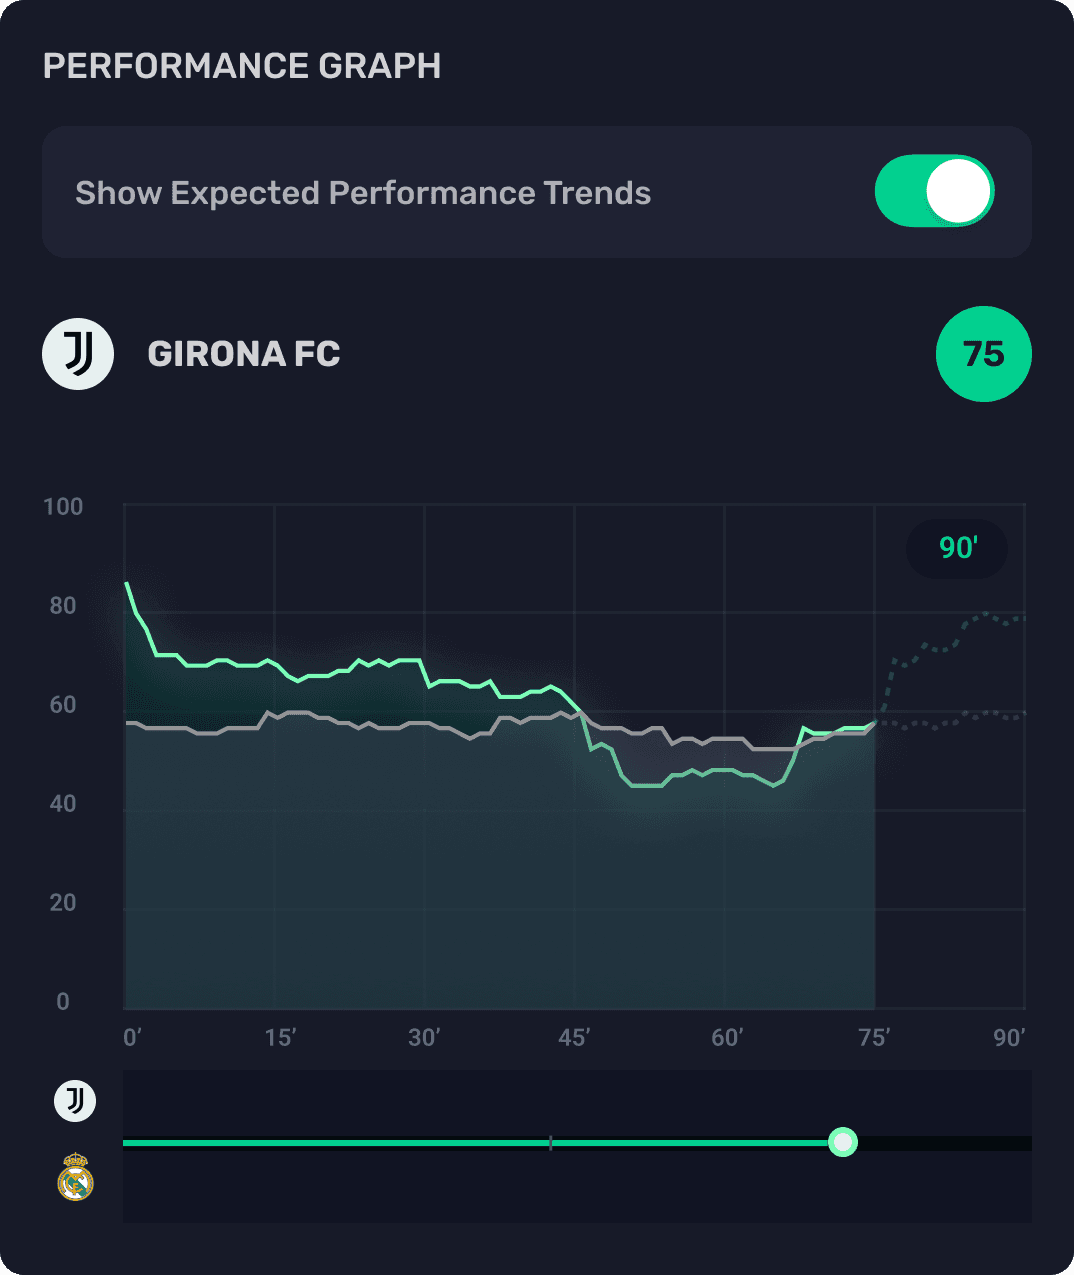
Imagine that AS Roma is underperforming as the second half begins. Their rtP drops to 45 points and stays low until the 65th minute. After conceding a goal, they pick up the pace and start improving. Their rtP begins to rise following a distinct trendline pattern. By the 75th minute, we can use the Expected Trends to see how the match may evolve.
The graph shows that teams generally continue to push and maintain an rtP level of at least 70 by the end of the match.
Read more about the Expected Trends feature
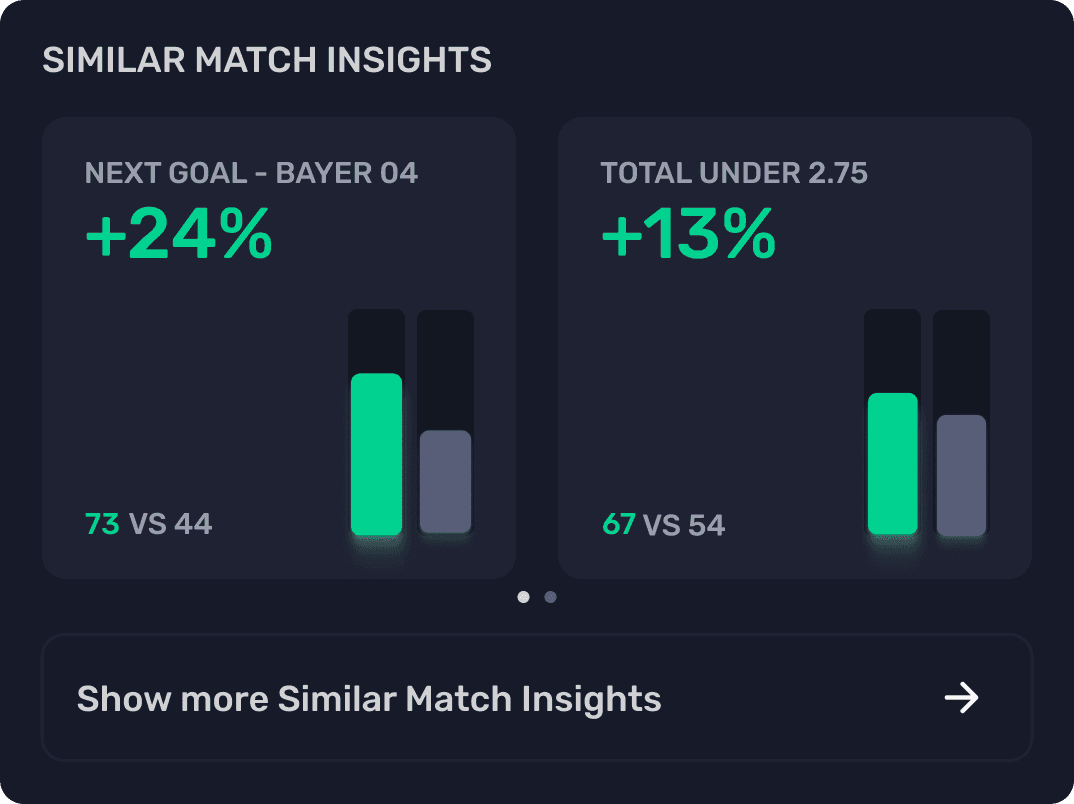
But the graph is not the only application of this technology. The knowledge of the results of past similar matches allows us to find how many of them had the selected outcome, like win-loss, number of goals, exact score, and more. This is reflected in the Similar Match Insights feature.
Read more about the Similar Match Insights feature
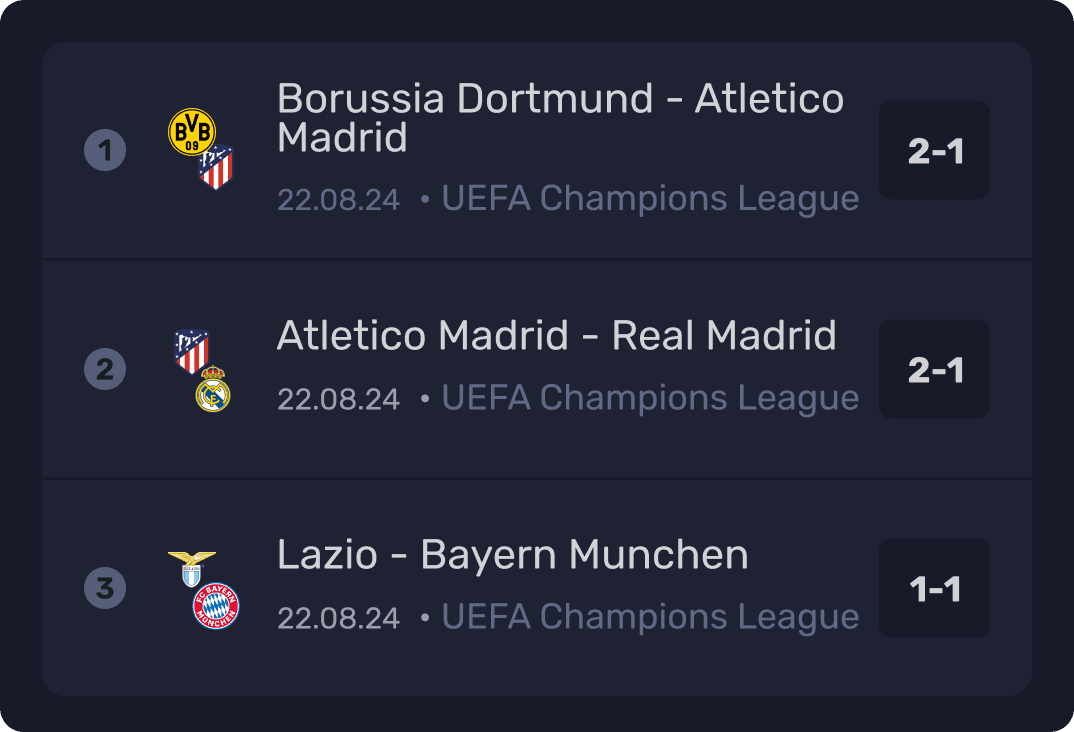
Additionally, to simplify comparisons, the algorithm selects the Top 3 Similar Matches. These matches demonstrated the highest level of rtP and xP trendline similarity. This selection helps you understand potential match outcomes.
There is one more application of the Similar Match Technology: real-time Power Index (rtPI) It enables us to compare different matches, allowing us to evaluate the team's performance based on a specific xP level.
For example, if Arsenal has a 84 rtP rank while having a 61 xP rank at a given moment, we can analyze hundreds of matches with the same xP rank at that point in time. This comparison allows us to visualize Arsenal's performance against others on a line chart, providing valuable insights.
This demonstrates that a 84 rtP rank is better than 92% of teams that had the same xP rank.
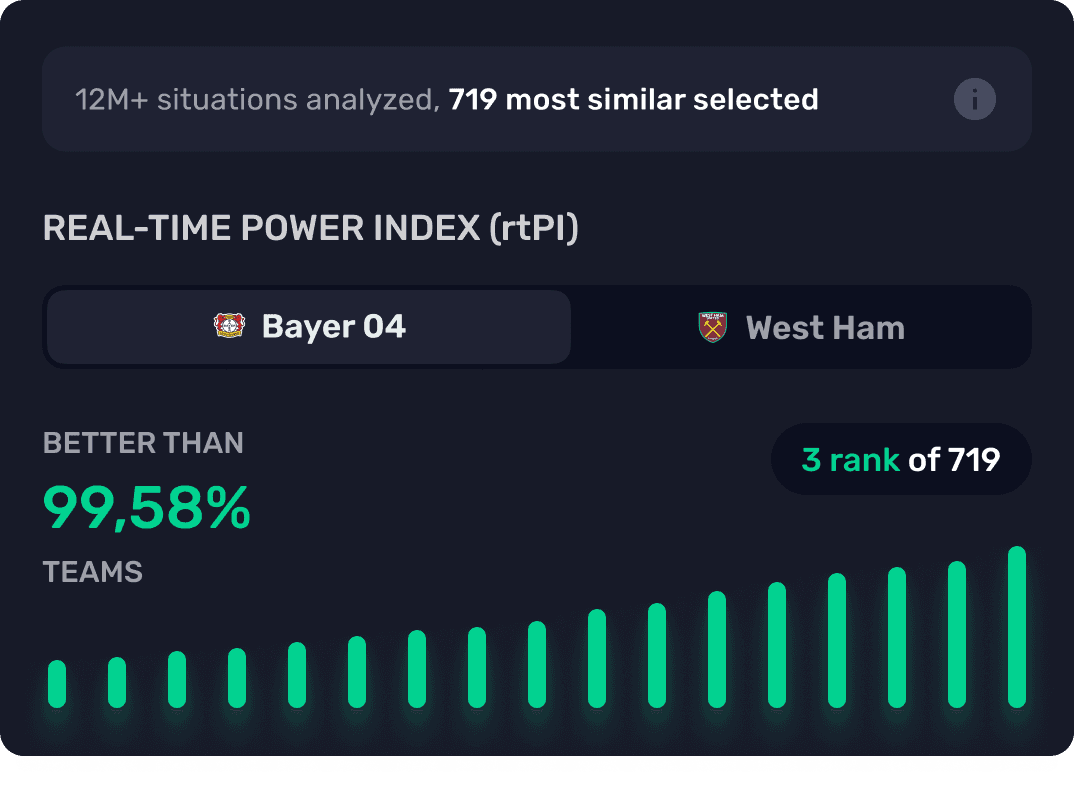
To conclude, this indicates that Arsenal is currently performing unexpectedly well, outperforming 92% of teams with the same level of expectations.